
Quantitative Risk Assessment (QRA) at EPConsult Energies
At EPConsult Energies, QRA is a critical tool in ensuring safety and operational excellence. It systematically identifies, quantifies, and evaluates risks in high-stakes environments like oil, gas, and renewable energy sectors. Our service goes beyond regulatory compliance, providing data-driven insights to minimize risks and optimize decision-making.
Key Benefits of QRA:
- Regulatory Compliance
- Risk Reduction via Risk Reduction Measures (RRM)
- Societal & Asset Risk Exposure Analysis
- Incremental Risk Assessment for Modifications
- Comprehensive Hazard Modelling (fire, explosion, structural failure)
- Strategic Safety & Cost-Optimization Recommendations
Data Gathering and Document Reviews
The first step is familiarisation with work scope and base data; and then a kick-off meeting will be scheduled to verify data and project schedule. We produce an Assumptions Register containing QRA rule sets, and probabilities for safety critical events for client endorsement.
Hazard Identification (HAZID) and Identification of Isolatable Sections
The HAZID Study assesses and risk ranks the identified major hazards. The study provides input to a Hazards & Effects Register, and identifies which Major Accident Hazard (MAH) scenarios are forwarded for QRA. For loss of containment MAHs, isolatable sections in the QRA are identified and inventory details are documented in the Assumptions Register.

Figure: ALARP Triangle
Frequency Analysis and Consequence Modelling for oil & gas facilities
Failure rate data is selected from OGP: Risk Assessment Data Directory, Report No, 434, March 2010. Where statistical data is not applicable, we use Fault Tree Analysis to derive the frequency for the Top Event.
EPConsult uses consequence modelling software to analyse ignited and un-ignited releases and those that undergo delayed ignition. Contours for impairment and warning parameters are plotted on facility plot plans.
Event Tree Analysis (ETA) & Selection of Release Size
We use Event Trees Analysis to display the evolution of the MAH and to estimate, with fatality rule sets, the Potential Loss of Life (PLL) and Individual Risk per Annum (IRPA) for each scenario. The probability of successful control of a developing accident scenario is based on the performance of the safety systems. Event trees establish a link between risk values and safety critical events and can set performance requirements of Safety Critical Elements (SCEs).
Control of Releases by Emmergency Shut Down (ESD) and Blow Down
Sensitivities regarding the positive effect of blow down can be undertaken, as can the impact of internal leak rates through Emmergency Shut Down Valves (ESDVs).
Risk Analysis
Frequency assessment and consequence are combined for all MAH scenarios to define the risks from plant to onsite and offsite personnel. Risk contours are plotted on facility plot plans. F-N Curves graph the frequency of risk events with a particular consequence or greater versus the consequence magnitude. Sensitivity analyses are carried out for key assumptions and inputs to test the robustness of the results.
Risk Assessment
Where energy risks are “acceptable”, detailed As Low As Reasonable Practical (ALARP) justification is not required: a qualitative justification of Risk Reduction Measures (RRMs) suffices. However, where risks lie in the ALARP region, a more detailed justification using Cost Benefit Analysis (CBA) is required. Where the risk levels are in the “Unacceptable” region, then the risk cannot be justified without RRMs of the highest integrity. The ALARP principle is used by United Kingdom's Health and Safety Executive in its regulation of the major hazard industries and distinguishes the three levels of risk - used to inform risk reduction measures in oil and gas fields. Our process safety and risk assessment services may also include:
- Computational Field Dynamics (CFD)
- Fire and Gas detection study
- Simultaneous Operations Study (SIMOPS)
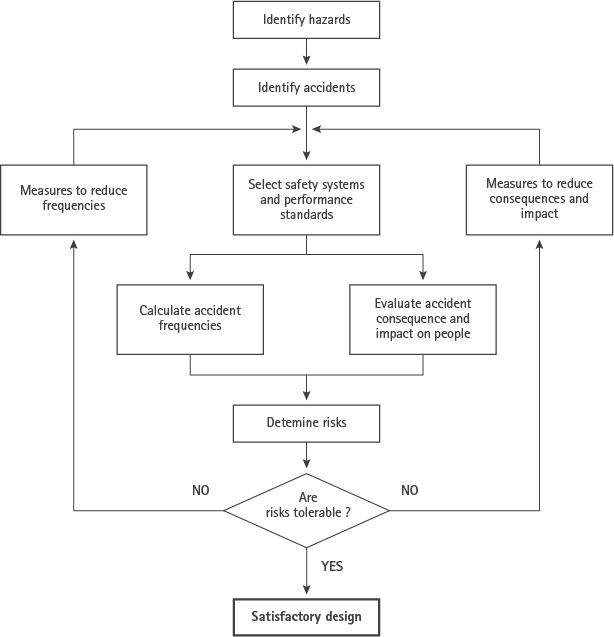
Risk Reduction Measures
Potential risk acceptance criteria and risk reducing measures will be identified and evaluated. The potential risk reduction measures may include the means to decrease the probability of a loss of containment or measures to mitigate the consequences of a release.